Leveraging emerging technologies to enable environmental monitoring and accountability in conflict zones
Share this article

The growth of access to the internet, wide availability of smart phones and increased public access to remote sensing data from hundreds of satellite systems have spurred a revolution in tracking the linkages between armed conflict and environmental damage. Over the last decade, a growing community of open-source investigative experts, environmentalists, academics and civil society groups have applied these methods to document war crimes, human rights violations and environmental degradation. These developments have created new opportunities for building accountability and transparency. The wealth of data on conflict-linked environmental damage has already been successfully leveraged to address acute and long-term environmental health risks and inform humanitarian response and post-conflict environmental assessments in Iraq, Syria and Ukraine. There are, however, larger questions on how to best make use of these data streams and information layers, and how to navigate the opportunities and limitations of these developments. This article will outline the new developments in this field and provide recommendations to ensure that data is used responsibly and effectively to strengthen accountability for environmental damages as a result of armed conflict.
* Wim Zwijnenburg is Humanitarian Disarmament Project Leader, PAX, Utrecht, the Netherlands; Ollie Ballinger is Lecturer in Geocomputation, Centre for Advanced Spatial Analysis, University College London, UK
Wim Zwijnenburg is a long-time contributor to Bellingcat, an open-source research collective. Ollie Ballinger is a Tech Fellow at Bellingcat.
Corresponding author: Wim Zwijnenburg, email: Zwijnenburg@paxforpeace.nl
Nature, an invisible victim of armed conflict
The often-used phrase describing the environment as a “silent victim” of armed conflict1 holds true to the extent that the level of destruction of and consequences for public health and ecosystems have gone largely unnoticed. Despite the visually impactful events of the Gulf War oil fires in 1991, limited attention was given to the widespread environmental destruction and the impact on lives, livelihoods, ecosystems and climate. The lack of visibility of conflict-linked environmental degradation also prevented the political debates and policy responses needed to prevent, minimize and mitigate environmental impact and strengthen accountability for military conduct. The bulk of the work conducted on the environmental dimensions of armed conflict until the early 2010s was largely driven by either the United Nations Environment Programme (UNEP) through its post-conflict environmental assessment,2 or by legal scholars discussing the challenges for international law in relation to the environmental impacts of armed conflict.3 Within the humanitarian disarmament community, civil society efforts have been successful in banning or regulating certain weapons and their impacts on health and well-being. The environmental consequences of armed conflicts, however, have received limited attention, with exceptions around the use of depleted uranium (DU) in munitions4 and initiatives around the health and environmental impacts of Agent Orange, used by the United States in Vietnam.5
The main hindrance to attracting attention to the topic and building a solid campaign was the absence of a clear overview that demonstrated the severity of conflict-linked environmental damage throughout the cycle of conflict and laid out how this directly impacts people's health, livelihoods and futures. By contrast, past humanitarian disarmament campaigns, such as those banning landmines and cluster munitions or regulating the international arms trade, were able to build upon a wealth of visible impacts of weapons on people and their livelihoods that both helped raise international awareness of the humanitarian consequences while at the same time also functioning as an accountability instrument for the States using them. The causation between the weapon and its impact was fairly straightforward, which in turn benefited the international advocacy efforts.
Addressing the impacts of environmental damage on civilians, on the other hand, has proved more difficult, as demonstrating the relationship between exposure to toxic remnants of war, such as DU, and subsequent health impacts seems to be a Herculean task. This is due to the complexity around pre-existing environmental and health issues, mixed with the absence of relevant data to set up reliable scientific research that proves the causal link between illnesses and exposure to conflict-related pollution sources. Gaining access to military data on munitions use and the locations of such use, as well as on the targeting of specific objects that could result in the release of contaminants posing risks to civilians, has been a long-standing problem for humanitarian and civil society groups.6 In the case of Iraq, for example, it took years of legal back-and-forth using freedom of information requests to the US and Dutch governments to get data on the coordinates of DU. This type of data is pivotal in the immediate aftermath of conflict to facilitate clean-up and remediation efforts, and would help to set up proper environmental health surveillance among possible exposed populations.
Having limited or no access to geographical data on conflict events, exposed populations, potential pollution sources, infrastructure damage and land use has posed serious challenges for campaigners and scholars alike in their work to improve understanding of the more complex direct and long-term impacts of conflict on the environment. As a result, the environment as a casualty of armed conflict has remained largely invisible among both States and global campaigners – at least until a decade ago, when increased worldwide access to the internet, combined with the rise of smartphone use, changed the global media landscape. This also brought conflict closer to home, putting the spotlight on developments where everyone could see what was happening directly on their smartphone. What promises did this technological turn of events bring for strengthening protection of the environment in armed conflicts, and for a stronger environment, peace and security agenda?
Armed conflict, data and the World Wide Web
A fundamental game-changer for researchers, journalists and civil society groups was the rapidly growing access to the internet and spread of smartphones that drastically changed the playing field. With access to the internet, people could post videos, photos and information on a myriad of online platforms, including a growing amount of popular social media platforms such as Twitter, Facebook and YouTube, or share them among groups of people using applications such as Telegram and discussion boards like Reddit. When protests in Syria escalated into armed conflict, the use of social media to share information with the world as the events unfolded proved essential to grasping what was happening on the ground. Syria has been referred to as the most documented armed conflict in history,7 as citizen and civil society organizations have gathered and shared information from social media sources to document potential wrongdoing8 conducted by the warring parties.9
This gave rise to a new form of journalistic research: “open-source investigations” or “open-source intelligence”, better known as OSINT. This strand of work was originally linked with government intelligence agencies using information sourced from traditional, publicly accessible media, but now refers to researchers’ and journalists’ use of the wealth of open-source information to document conflict-related events. The work by the Bellingcat investigative journalism collective, in particular, helped lead10 the innovation of this strand of research by documenting potential war crimes and grave human rights violations in areas affected by armed conflict.11 These new tools brought with them a gigantic amount of data that could be used to identify possible locations of war crimes, track down responsible individuals or groups and in general document conflict-linked damages in near-real time. Many traditional news outlets soon started their own open-source teams, often producing groundbreaking investigative pieces12 mixing both OSINT and on-the-ground investigations to shed light on alleged grave human rights violations or outright war crimes. The International Criminal Court (ICC) even admitted OSINT as evidence for an arrest warrant against a Libyan militant commander whose actions were captured on film, which could be geolocated and confirmed, paving the way for more prosecutions based on open-source materials.13
These new approaches for using OSINT also found their way into the documentation of environmental crimes14 and conflict-linked environmental degradation.15 Existing risk assessment models for disasters, such as the Flash Environmental Assessment Tool,16 were first used in combination with OSINT to identify areas at risk from conflict-related pollution in Syria17 and to document the scale of environmental destruction in Iraq18 and Ukraine,19 both in 2017. This application soon became more common in assessments conducted by UN agencies20 and humanitarian responders, building a better environmental situational awareness of a wide variety of risks in conflict-affected areas.
Despite these advantages, OSINT also comes with serious challenges, mainly driven by mis- and disinformation efforts. State and non-State actors, as well as ideologically driven online communities, have at times created and spread fake imagery and claims from conflict areas in disinformation campaigns, as a means to fuel uncertainty and doubt among the general public.21 This trend demonstrates the necessity of having an additional verification layer to using information from social media networks. Though many expect that artificial intelligence (AI) will contribute to increased spread of mis- and disinformation, so far technology is able to quickly disprove fakes.22 The main challenge is how to ensure a rapid awareness-raising response to the disproven fakes in order to counter disinformation campaigns.
Space-based environmental monitoring
The development of OSINT went hand in hand with the dramatic increase in both the availability of satellite imagery and the computational resources required to derive insights therefrom. Open access satellite imagery is typically lower-resolution, including the European Space Agency's Sentinel-2 satellite (10m/pixel) and the US National Aeronautics and Space Administration (NASA) Landsat programme (30m/pixel). While these datasets are too coarse to identify individual objects, they can be used to monitor larger-scale phenomena such as oil spills, crop burning or deforestation.23 High-resolution imagery from private companies such as Maxar, Airbus and Planet ranges from 30 to 50 centimetres per pixel. This type of imagery is rarely open access, but recently, high-resolution imagery has increasingly been available through Earth observation (EO) platforms such as Google Earth Pro which provide historic high-resolution imagery that can be instrumental for investigations. Many of these companies choose to release open data in response to natural disasters or similar events.
Even optical satellites with a very low spatial resolution can provide important information on conflict-induced environmental degradation. The Moderate Resolution Imaging Spectroradiometer (MODIS) has a spatial resolution of 1 kilometre per pixel, making it impossible to identify distinct features such as buildings or trees, yet what it lacks in spatial resolution it makes up for in spectral and temporal resolution – MODIS can image the entire planet every one to two days and can even automatically detect thermal anomalies from space.24 NASA's Fire Information for Resource Management System provides daily data on active fires in near-real time, and has historic data going back to the year 2000. These detections can be used to track fires caused by fighting. Beyond estimating the scale and environmental toll of areas burned by fighting, such fire detections can also serve to verify the timing and locations of individual attacks, increasing public accountability. The Operational Linescan System, part of the US Defense Meteorological Satellite Program, is now also widely used to detect night-time lights, or the absence thereof; this could help determine to what extent access to energy has been cut off by damage to energy infrastructure.25
Spectrometer instruments can also be used to track air pollution caused by conflict events. The Copernicus Atmosphere Monitoring Service (CAMS) combines data from a range of different sensors, including the Sentinel-5p satellite, to provide atmospheric data at a spatial resolution of 45 km on an hourly basis. One application of CAMS data, for example, showed a sulphur dioxide plume resulting from an attack on the Al-Mishraq Sulphur Plant in Iraq,26 a plant used to produce sulphuric acid for use in fertilizers and pesticides. The attack destroyed the plant, causing a fire which burned for a month and released 21 kilotons of sulphur dioxide into the atmosphere per day – the largest human-made release of sulphur dioxide in history.27 Beyond assessing the extent of a single event such as the Al-Mishraq fire, spectrometers measuring atmospheric gasses can also help to quantify routine exposure to hazardous levels of various pollutants such as nitrogen dioxide. Though air pollution can be measured using ground sensors, these are rare in conflict-affected areas.
While optical sensors and spectrometers rely on reflected sunlight in order to image, synthetic aperture radar (SAR) imagery is a type of remote sensing that uses radio waves to detect objects on the ground. These active sensors generate their own illumination and are able to produce imagery through cloud cover and even at night. SAR imagery has played an important role in environmental monitoring.28 For example, because oil creates a slick surface and thus alters the way in which radio waves are reflected off of water, radar imagery has been used extensively to detect oil spills, including in conflict-affected areas.29 More recently, SAR has also been applied to obtain rough estimates for urban damage assessments.30
Application of remote sensing in armed conflicts
Remote sensing data has proven to be particularly helpful for tracking conflict-linked damage in numerous conflicts.31 A wealth of academic research has illustrated the utility of remote sensing as an essential instrument that helps reveal the scale of land cover impacts linked with conflict, such as deforestation driven by fuel needs from the armed conflict in Syria,32 forest cover changes associated with peace negotiations in Colombia,33 and forest conservation in Rwanda.34 Other research has focused on agriculture, demonstrating changes in agricultural land use in Syria,35 increased yields from crops that may fund armed groups in Iraq,36 and food insecurity caused by conflict-driven land abandonment in South Sudan.37 There is also growing interest in using geographic information systems (GIS) to quantify air pollution from conflict-linked sources38 and to map nature reserves and protected sites at risk from armed conflicts.39 The ongoing Russia–Ukraine armed conflict has witnessed a surge in interest in GIS-based analysis that is yielding interesting results. A US-based consortium of universities and government agencies has set up the Conflict Observatory, providing a wide-ranging assessment of conflict impact, including on agriculture40 and food security.41 Both international and Ukrainian civil society groups have combined open-source data with EO to document the environmental dimensions of the conflict, focusing on energy infrastructure,42 water infrastructure,43 deforestation44 or providing public databases with reported incidents with potential environmental consequences.45
Over the last decade, civil society groups and humanitarian organizations have also addressed the use of explosive weapons in populated areas,46 ultimately resulting in a broadly supported political declaration.47 The intense damage caused by these weapons in urban areas poses additional risks to civilians from, among other things, environmental harm.48 Remote sensing combined with OSINT is already being used for rapid damage assessments in Iraq,49 Gaza50 and Ukraine,51 which in turn are helping to identify hazardous sites in urban areas and quantify the debris and rubble, often mixed with hazardous materials.
Democratization of environmental research
Prior to the smartphone and EO data boom, most of the environmental assessment work carried out by UN agencies was done post-conflict, often years after the wars had ended, and was thus limited in types of locations and data on conflict impacts. In addition, this type of expert analysis was largely conducted by specialized agencies with trained experts. The revolution in environmental data collection analysis has meant that affected communities, campaigners and academics have direct access to specific information that can spur international campaigning to improve the protection of the environment. Several key multilateral processes and initiatives by international organizations to improve this protection were driven by the growing body of evidence that demonstrated the many layers of conflict-linked environmental degradation.
Since 2013, the International Law Commission (ILC) has been working to review existing legal avenues on the protection of the environment in relation to armed conflicts (PERAC), as legal principles need to be kept in line with modern developments and new insights. Over the course of nearly a decade, States met to discuss various draft principles put forward by the Special Rapporteurs leading this process. Though the process was unfortunately limited in nature in terms of civil society participation, NGOs and experts did have the opportunity to brief States in a number of public consultations on specific issues linked with conflict that helped underscore the importance of developing progressive international law. The final set of PERAC Principles was adopted by the ILC and was welcomed in late 2022 at the UN General Assembly in a resolution that “brings [the Principles] to the attention of States, international organizations and all who may be called upon to deal with the subject, and encourages their widest possible dissemination”.52
On a practical level, the wealth of research further spurred attention on the topic. The dark visual imagery of the 2016–17 oil fires at Qayyarah in Iraq, blackening the skies for months, combined with ongoing research, proved to be instrumental53 for cementing support in getting a strong UN Environment Assembly (UNEA) resolution on conflict pollution in 2017, led by Iraq.54 From a human rights perspective, a better understanding of civilians’ exposure from toxic remnants of war based on civil society input was further reflected in debates at the UN Human Rights Council, where UN Special Rapporteurs included concerns over children's exposure to hazardous war remnants55 and the broader need for information on communities affected by conflict pollution.56
The linkages between environment and security gained further traction in the UN Security Council's work, where in particular better documentation of environmental harm57 and links with detrimental public health impacts were reflected in the UN Secretary-General's report on the protection of civilians since 2019,58 helped by further attention given during Arria-Formula meetings59 and specific country discussions on the environment–security nexus.60
The picture that emerges from these technological developments and multilateral discussions outlines the importance of evidence-based advocacy. Furthermore, the innovative use of these developments can create meaningful change that builds momentum toward improving protection of the environment, people and the planet. Yet the future holds more potential, and the pace of technological change is rapidly increasing. With the rise of computer algorithms, how can researchers, humanitarians and campaigners make full use of this digital potential?
The future of conflict-linked environmental analysis
Current developments and future opportunities in analytical capabilities can be understood by exploring the application of modelling, machine learning (ML) and AI in environmental data analysis in conflict-affected areas. These include the proliferation of no-code remote sensing platforms, open-source software packages and free cloud computing services, all three of which significantly reduce barriers to public and professional monitoring and analysis of conflict-linked pollution, deforestation, water security, urban damage assessment and broader patterns of environmental harm that can be linked with military operations, along with the consequences for civilians, biodiversity and livelihoods.61
Big data, machine learning and artificial intelligence
The increasing quantity and quality of satellite imagery has been met with a commensurate increase in computing power, enabling insights that were previously unfeasible. Moore's law –the observation that the performance of integrated circuits increases exponentially over time – is particularly relevant to the field of open-source remote sensing.62 In the past ten years, many models of laptops have seen the number of central processing units increase more than sixfold. Graphics processing units, once a rarity, are becoming increasingly common in consumer electronics. The growth in computational power has considerably lowered the barrier to entry for the analysis of satellite imagery, previously limited to well-resourced organizations, and it is now possible to perform complex analyses on the average laptop. Beyond the planetary computers discussed below, there is also a growth of no-code platforms for visualization of satellite imagery.
Yet an even more significant development in the area of computing has been the growth in cloud computing platforms for the analysis of satellite imagery, particularly since 2016. These can be roughly divided into two categories: no-code platforms for the visualization of satellite imagery, and planetary computers capable of analysis at a global scale.
No-code platforms
Sentinel Hub is an online platform that allows users to access satellite imagery collected by the European Space Agency's satellites, NASA's Landsat and MODIS satellites, and other providers. Users can display imagery from different dates and perform basic image processing and analysis with a graphical user interface. Similarly, NASA's Worldview platform aggregates data from a wide variety of EO systems and allows them to be easily accessed with an intuitive interface.63 These platforms have enabled anyone with an internet connection to load medium-resolution imagery of virtually anywhere on Earth in near-real time, without the need for technical skills or computing resources. Though advanced analysis is not possible on these platforms, simply visualizing multi-temporal satellite imagery enables monitoring of infrastructural damage, deforestation, pollution and a variety of other conflict-induced threats to the environment.
This can be explained by using the example of rare-earth mining in Myanmar, a toxic practice that is severely polluting the environment.64 Sentinel Hub can be used to deliver insights on the proliferation of mines. Because these mines have precipitation pools filled with water, the location of such pools can be used to identify mines. Figure 1 visualizes a Normalized Difference Water Index (NDWI) calculation applied to a Sentinel-2 image, a simple process that highlights water in a scene and that can be applied with one click. Clicking on a point on the map visualizes the NDWI value at a given location over time.
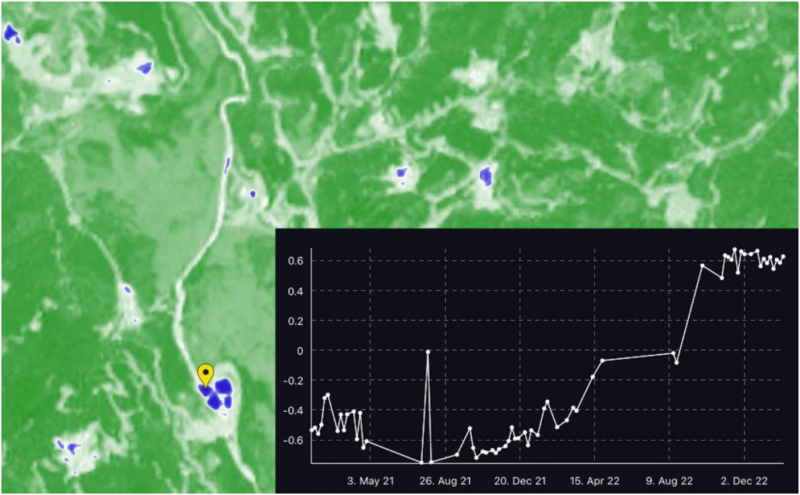
The graph in Figure 1 shows negative NDWI values for all of 2021, followed by a steep increase in August 2022, after which persistently high NDWI values are recorded. Sentinel Hub allows virtually anyone to verify the construction date of an unregulated mine in Myanmar, with just a few clicks.
Planetary computers
As geospatial datasets – particularly satellite imagery collections – increase in size, researchers are increasingly relying on cloud computing platforms such as Google Earth Engine (GEE) or the Microsoft Planetary Computer to analyze vast quantities of data. GEE is free for individuals and academic researchers and allows users to write open-source code that can be run by others in one click, thereby yielding fully reproducible results. These features have put GEE on the cutting edge of scientific research. Figure 2 visualizes the number of journal articles produced using different geospatial analysis software platforms.
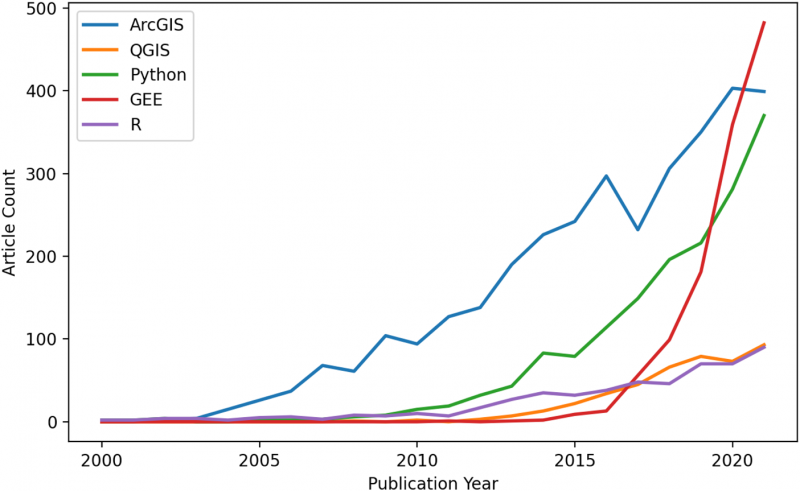
Despite only being released in 2015, the number of geospatial journal articles produced using GEE (shown in red in Figure 2) has outpaced every other major geospatial analysis software, including ArcGIS, Python and R, in just five years. By storing and running computations on Google servers, GEE is far more accessible to those who do not have significant local storage or computational resources.
Optical satellite imagery can be combined with ML to deliver insights on conflict-induced pollution that would otherwise be unfeasible. Natural resource extraction often plays a role in conflict, as it offers a source of revenue for belligerents. Beyond fuelling armed conflict, such activity often has catastrophic consequences for the environment. Knowing the locations of these extraction sites is a prerequisite for their eventual clean-up, but active fighting can preclude the conduct of field surveys.
One example of conflict-related resource extraction involves the above-mentioned case of rare-earth mining in Myanmar, which takes place in mountainous areas of the country's northeast. The processes used to extract heavy rare earths are highly polluting, ravaging landscapes and poisoning waterways. Figure 3 shows the location of over 2,700 such mines, identified manually by Global Witness.
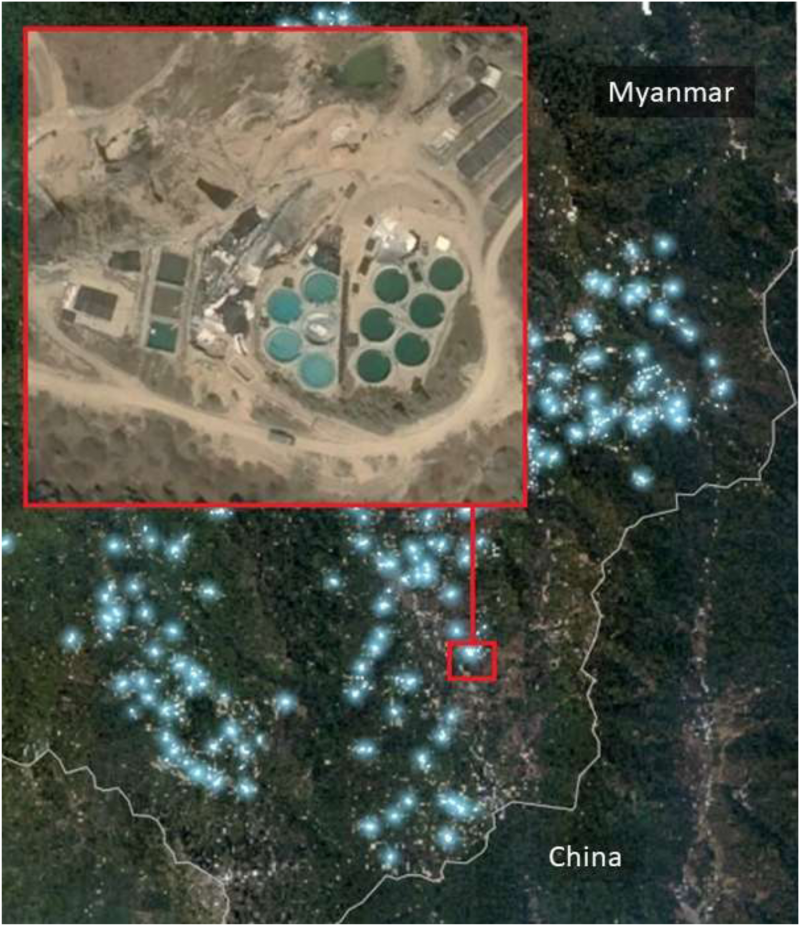
The inset satellite image in Figure 3 shows a close-up of one mine; bright blue “precipitation pools” – used to precipitate out minerals from a slurry of ammonium sulphate and mud – are a characteristic feature of such mines. Runoff from these pools leeches directly into the N'Mai Kha River, which runs the length of Myanmar and whose basin is home to two thirds of the country's population. By some estimates, the pollution caused by chemicals seeping into water bodies could take up to a century to clean up.
Using the labelled locations of pools as a training dataset, a convolutional neural network (CNN) can be used to automate the detection of pools beyond the study area, or in new imagery as it becomes available. Figure 4 shows the results of inference conducted by an object detection model using different source imagery to that which it was originally trained on.
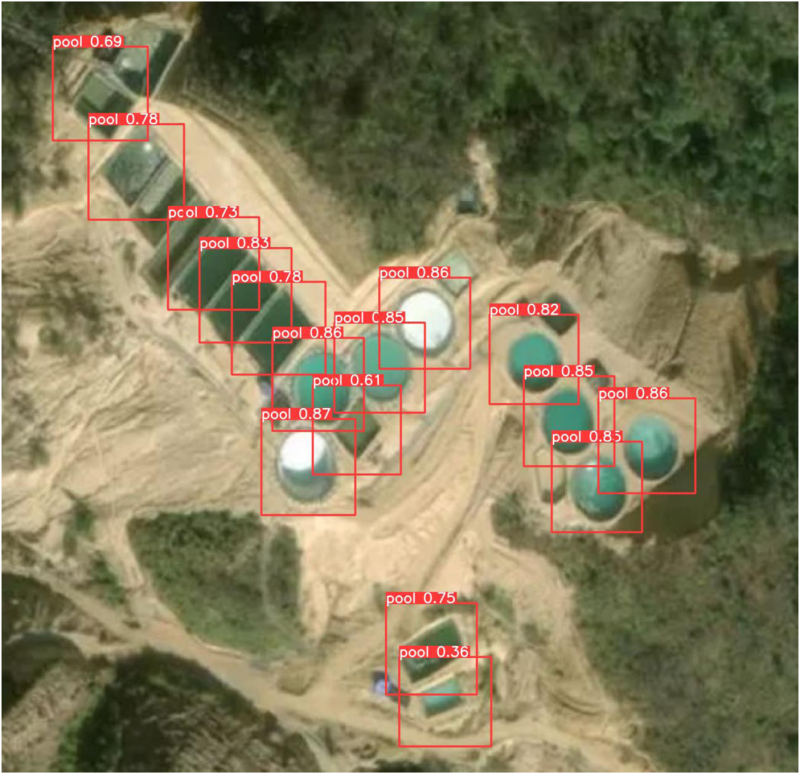
High-resolution optical satellite imagery and AI can thus be used to precisely identify the locations of highly polluting mines in an active war zone. This general approach is not confined to a particular geography and generalizes well to other contexts.
Machine learning and artificial intelligence
Within the humanitarian response community, there is growing interest in applications to improve analysis and response using ML. For example, ML is already being used to quickly identify informal settlements, conduct flood analysis and track flows of displaced persons.65 Promising improvements use deep-learning (DL) models, often applied for land classification; examples of DL application in conflict areas will be outlined below. Researchers have tried various specialized DL models to identify oil spills and vegetation changes,66 and the application of AI is gaining popularity in the field of remote sensing.67 In conflict-affected areas, there have been attempts to apply AI to the detection of unexploded ordnance, using images taken by small drones; such initiatives can support swift remediation and land clearance efforts.68
Review of tasks applying AI to satellite imagery
| Task types | AI techniques | Data |
|---|---|---|
| Low-level vision tasks | ||
| Pan-sharpening | GAN | WorldView-2 and GF-2 images |
| Denoising | LRR | HYDICE and AVIRIS data |
| Cloud removal | CNN | Sentinel-1 and Sentinel-2 data |
| Destriping | CNN | EO-1 Hyperion and HJ-1A images |
| High-level vision tasks | ||
| Scene classification | CNN | Google Earth images |
| Object detection | CNN | Google Earth images, GF-2, and JL-1 images |
| Land use and land cover mapping | FCN | Airborne hyperspectral/VHR color image/LiDAR data |
| Change detection | SN and RNN | GF-2 images |
| Video tracking | SN and GMM | VHR satellite videos |
| Natural language processing-related tasks | ||
| Image captioning | RNN | VHR satellite images with text descriptions |
| Text-to-image generation | MHN | VHR satellite images with text descriptions |
| Visual question answering | CNN and RNN | Satellite/aerial images with visual questions/answers |
| Environment monitoring tasks | ||
| Wildfire detection | FCN | Sentinel-1, Sentinel-2, Sentinel-3 and MODIS data |
| Landslide detection | FCN and Transformer | Sentinel-2 and ALOS PALSAR data |
| Weather forecasting | CNN and LSTM | SEVIRI data |
| Air quality prediction | ANN | MODIS data |
| Poverty estimation | CNN | VHR satellite images |
| Refugee camps detection | CNN | WorldView-2 and WorldView-3 data |
Acronyms used in “AI Techniques” column: artificial neural network (ANN); convolutional neural network (CNN); fully convolutional network (FCN); generative adversarial network (GAN); Gaussian mixture model (GMM); low-rank representation (LRR); long short-term memory network (LSTM); modern Hopfield network (MHN); recurrent neural network (RNN); Siamese network (SN).
Source: Yonghao Xu et al., “AI Security for Geoscience and Remote Sensing: Challenges and Future Trends”, IEEE GeoScience and Remote Sensing Magazine, Vol. 11, No. 2, 2023, available at: https://arxiv.org/pdf/2212.09360.pdf.
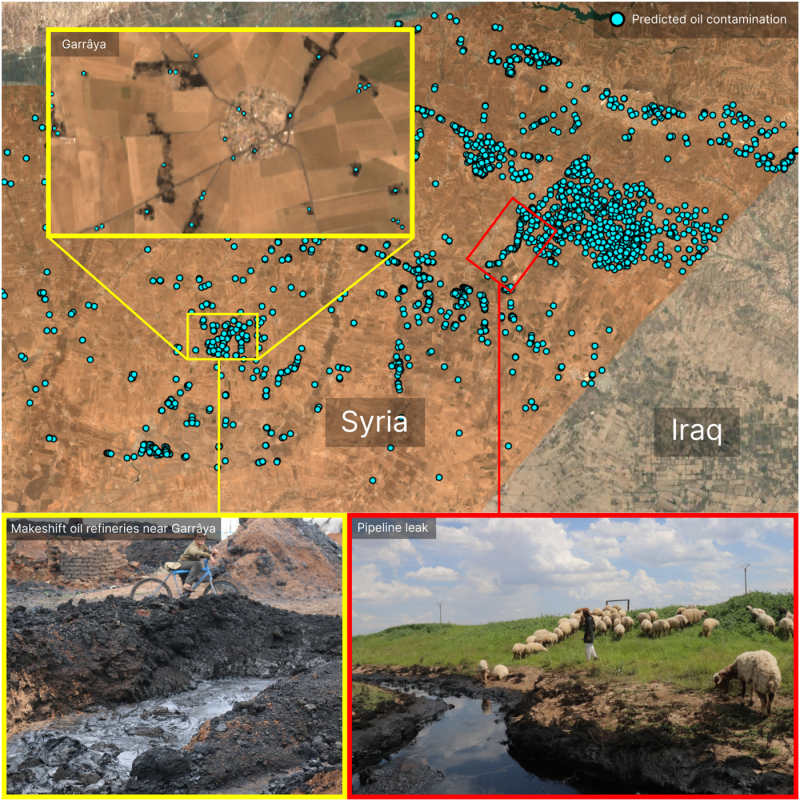
As discussed above, natural resource extraction often plays a role in conflict – despite its potentially catastrophic consequences for the environment – as it offers a source of revenue for belligerents. One example of this is the proliferation of makeshift refineries in northern Syria during the civil war. The destruction of Syria's oil infrastructure and the importance of oil as a source of revenue for armed groups has led to a rise in makeshift oil extraction and refining. These makeshift refineries are often constructed by digging a large pit, lining it with tarpaulin and filling it with polluted water. A furnace heats crude oil, which is run through a pipe cooled by the basin and collected in drums. These refineries also frequently leak, blackening large swaths of land around them.69
Previous efforts to quantify informal oil production have involved manually sifting through satellite imagery and counting the makeshift refineries. This is a painstaking process that leaves a number of important questions unanswered. Even if one were to count all of the individual refineries, could we get an estimate of the polluted area? What if we wanted to count the refineries in a new part of Syria, or get annual or even monthly estimates of new refineries?
Using a combination of optical and radar imagery (Sentinel-1 and Sentinel-2) and a handful of known locations of such refineries, an AI model can be trained to identify areas contaminated by oil. The process of identifying refineries and oil spills can thus be automated across an area of thousands of square kilometres, and updated as new imagery becomes available.
Figure 5 shows the locations of model predictions for oil contamination. Photographs taken on the ground of several makeshift refineries are used to ground-truth model predictions. The model identifies areas with a high density of such facilities, giving precise estimates of their spatial distribution. Planetary computers are also often used to facilitate the dissemination of findings by allowing users to create and share interactive applications. For example, the present authors have created a dedicated link70 which directs to an application visualizing the results of the ML-based identification of makeshift refineries in northern Syria mentioned above. The application allows users to draw a rectangle on the map, which returns the total number of contaminated points in the area of interest as well as the number of contaminated square metres. Such tools could be used or adapted by practitioners to deliver actionable insights required for clean-up efforts.
Lastly, with intense fighting in and shelling of populated areas, rapid damage assessments are vital for first responders and analysts working on debris removal and management to get a clear understanding of the scale of destruction and health risks.71 ML applied to Sentinel-1 SAR imagery can be used to get an estimate of damaged buildings. Users can select their own area of interest to generate the percentage of urban areas that have been affected by the war.72 Though this is an area that is still in development, with numerous challenges, it has been identified as an area of future potential by researchers applying ML to damage assessment of cities affected by ongoing wars.73
The examples given above provide an overview of the successful use of remote sensing tools in conflict-affected areas, but remote sensing also comes with significant limitations.74 Firstly, in war zones with more cloud cover, such as tropical areas, or during wintertime, poor aerial visibility will constrain the timely availability of optical imagery. A second barrier is access to very high-resolution data; this type of data is still relatively expensive to acquire for researchers or organizations with small or no budgets. In addition, archive imagery from commercial providers frequently contains data previously ordered by their clients, which are often States or large corporations that have a certain location bias for security or commercial reasons. So, for example, there is abundant imagery on oil installations and certain urban areas in northern Libya, but hardly any imagery of rural areas in South Sudan, as there has been, to date, limited interest from commercial parties in acquiring these images.
Recent developments around air pollution detection pose similar challenges. Certain types of air pollution are not visible with the current resolution of public or satellite imagery; meanwhile, higher-resolution images are not easy to obtain as they are generated by specialized commercial satellites such as the latest one launched by the GHGSat project, dedicated to monitoring greenhouse gas emissions.75 This sensor is capable of detecting small methane emissions but is only available for paying customers. Whereas with other optical data, one can still use different medium-resolution imagery or ground-based data to track a potential impact, identifying invisible air pollution remains a challenge.
Thirdly, misinterpretation of satellite imagery in the visual interpretation process is frequent, and this misinterpretation could under- or overestimate environmental impacts. Understanding landscapes or broader environmental occurrences is elementary for “reading” satellite imagery in order to understand what one is looking at. There have also been incidents in which researchers have used faulty classification of band-spectrum data to identify a certain type of value associated with an environmental occurrence that could lead to misinterpretation of events – for example, classifying seasonal phytoplankton algae in the sea as oil spills. Such false positives can be cause for misinformation and over- or under-calculation of environmental damages. They underscore the necessity of critical review, caution and inclusion of local expertise in reviewing data.
Fourthly, the use of remote sensing is mostly a tool for identifying and quantifying environmental risks and damages, through which better responses, and data to be used in norm-building and strengthening, can be developed. In applying these methods, researchers do not have to rely solely on remote sensing to determine causality between military activities and their environmental consequences. Verification of data through multiple sources, including OSINT and ground-truthing, is elementary for any attribution questions. This is particularly relevant for legal and policy avenues when it comes to attribution of severe damages to specific actors for which they can be held accountable.
Beyond the misinterpretation of satellite imagery by analysts, the growing use of automated and semi-automated tools poses challenges as well. Computer vision models are being used at scale to conduct everything from building damage assessment76 to detecting mass graves.77 These models are trained by feeding an ML algorithm a large quantity of labelled data on the phenomenon of interest, but many computer vision models struggle with generalization and become more error-prone when the input data differs significantly from the training data.78
Errors of both omission and commission can have significant implications in conflict settings. In the context of environmental monitoring, false negatives can have disastrous consequences if they allow risks to go unnoticed. False positives, on the other hand, can waste resources marshalled to address environmental disasters that haven't actually occurred, and reduce trust in a model. In all cases, automated and semi-automated tools for the classification of satellite imagery must be consumed critically and supplemented with external information to ensure that the weight of the conclusions is supported by the strength of the evidence.
However, due to the aforementioned general scarcity of data in conflict settings, access to ground-truth data necessary to validate the predictions of automated systems may not be available. Critical consumption of the outputs of these systems becomes even more important in this context, and there are several avenues through which this can be achieved. For all classification tasks, there are a number of accuracy statistics that are conventionally reported. “Accuracy” simply refers to the ratio of correct predictions to the total number of predictions, but this can be misleading in cases where one class is much more prevalent than another. “Precision” measures the proportion of positive predictions that are true positives, while “recall” measures the proportion of positive labels that were retrieved by the model. Depending on the scenario, a false negative might be more dangerous than a false positive (for example, in cancer diagnosis), or vice versa. As such, users of automated and semi-automated systems would do well to delve beyond simple measures of accuracy associated with the models that they use.
Beyond model-level accuracy statistics, many models also provide information on the confidence level associated with each individual prediction. For example, CNNs used in object detection generally provide not only a classification but also an associated confidence score. A CNN trained to detect oil spills will thus not only highlight areas that it predicts to be oil spills but will also typically provide a score ranging from 0 to 1 denoting its confidence in this prediction. For ease of use, many products built on using such systems only communicate the classification result. Once again, it would behove analysts using such systems to carefully assess not only the prediction, but the associated confidence score.
Finally, there are conflict events that can result in environmental health risks but will go undetected for a long time with remote sensing data or open-source information. This could also create a technology bias, as in areas with limited internet availability or no use of smartphones to record incidents, the absence of information could create a data vacuum. Though remote sensing could partially cover this gap, awareness is needed in order to avoid focusing solely on digital evidence and to keep investing in conducting field assessments. Ground-truthing is also needed to verify remote sensing assessment, and particularly with the rise of citizen-science methods, there are ample means and methods for quickly collecting data in the field.79
Challenges and opportunities of innovative remote sensing for prevention of, response to and accountability for conflict-related environmental damage
This article set out to show how technology and digitization have shaped the trajectory of the environment–conflict nexus over the last decade. The application of open-source investigative techniques and satellite imagery has been an influential factor in the multilateral process to build and strengthen international norms around protection of the environment in relation to armed conflict. This is an important development that can further build accountability for environmental damages caused by States and non-State armed groups that have direct or long-term impacts on people and ecosystems. The ability to rapidly quantify the direct damage, such as the associated loss of livelihoods, the impact on food security or the exposure of civilians to a range of hazardous materials, has immense value. It has already been important for providing better guidance to militaries, as outlined in the updated Guidelines on Protection of the Natural Environment in Armed Conflict produced by the International Committee of the Red Cross (ICRC).80
These advances in remote sensing and open-source environmental investigations for conflict-linked environmental damages are, however, not providing a holistic picture. What this article demonstrates is that through these frontier technologies, the scientific insights of conflict-linked environmental damages went from a “low-resolution” to a “high-resolution” image of a war zone – i.e., the data and imagery are providing a clearer understanding of the reality on the ground. Despite these improvements, however, we do not yet have a “very high-resolution” image of this type of damage, due to the absence of solid ground-truthing of the data, and there are still a number of constraints and limitations, as shown above. Still, there is already significant progress in delivering insights and contributing to scientific knowledge of the environmental dimensions of conflict-related damage, while also pushing the policy debate on improving the protection of the environment in relation to armed conflict a significant step forward through quantification and visualization.
Moving forward, how can accountability be strengthened for environmental damage linked with military activities? The wealth of conflict data on environmental degradation that can now be generated is already strengthening norms, as the identification and publication loop is significantly shortened, providing media and policy-makers with near-real-time access to major events. This is particularly visible in the Russia–Ukraine armed conflict, where military operations around nuclear power plants closely monitored by satellites have spurred UN Security Council debates over the risks of a regional environmental catastrophe. The visibility of damage to the environment during that conflict has also renewed debates81 over including “ecocide” as a crime in the Rome Statute of the ICC. Though neither party to the armed conflict is party to the ICC,82 such a change would make it easier in the future to prosecute States and non-State actors for environmental damage. Exploring environmental accountability can build on historic examples around conflict-linked environmental damages, such as around the UN Compensation Commission's work on damages caused by Iraq's invasion of Kuwait,83 and can be applied to cases such as the damage to the Nova Kakhova dam in Ukraine and its resulting environmental impacts.84 The challenges ahead for such legal efforts relate to the proper registration of damages, having access to pre-conflict data, and developing a rudimentary environmental impact analysis that helps to quantify environmental damages, associated socio-economic costs, climate impacts and public health risks. Establishing causal relationships between military activities and widespread and long-term environmental damages can both have a norm-building effect and, in specific cases, feed into compensation mechanisms.
The attention on the environment in Ukraine has already resulted in millions of dollars of funding for the UN to establish coordination mechanisms to collect and analyze data and work on environmental clean-up, remediation and restoration efforts, and this approach should be applied to all conflict-affected countries.85
Building accountability also depends on political forums or policies around environmental protection that have strong implementation mechanisms, political support and funding within their mandates. Various UNEA resolutions on conflict and environmental impacts will certainly benefit from dedicated and consistent implementation to ensure that they are fulfilling the intent with which they were created. At the same time, other international bodies addressing climate or environmental issues that are impacted by conflict lack any recognition of the conflict–environment nexus; this includes the UN Framework Convention on Climate Change, the Convention on Biodiversity, and the limited engagement on military activities and environmental impacts at the UN General Assembly, UN Human Rights Council and UN Security Council. Here lies an opportunity for the international community to work towards establishing a comprehensive approach to the environment, peace and security – one that bridges the policy gaps, connects discussions between these UN forums and international agreements, and at a bare minimum, establishes response mechanisms for conflict-linked environmental emergencies.
The opportunities that technology brings to this debate revolve around the relative ease of obtaining detailed auxiliary-level data on the environmental consequences of armed conflict, the health risks to civilians, the impact on natural resources that generate income for affected communities, and the broader damage to unique ecosystems and protected areas. With the help of ML, existing datasets on built-up areas, known industrial locations, critical infrastructure, protected areas and nature reserves, types of land cover and climate data can be linked with conflict events and used in automated environment assessment tools and predictive modelling of risks to civilians and ecosystems. Depending on needs, humanitarian organizations can make direct use of this information to improve coordination and response. Better quantification of environmental damage and estimations of financial losses can drive political and military strategic discussions that could have a preventive effect on battlefield decisions which would otherwise lead to serious environmental damage. Moreover, it could spur rapid clean-up and remediation efforts with the use of AI that is able to rapidly undertake spatio-temporal analysis of affected areas and provide data to authorities and relevant international organizations. The use of AI should require supervision by experts to verify and validate the results in order to prevent misidentification and ensure accountability for outcomes. These technological developments will increase the speed of analysis and response time to conflict events, bring more granular details to specific environmental consequences and contribute to more visibility of these dimensions of conflicts.
What remains a hanging thread is where the responsibility lies for undertaking such an imperative and groundbreaking effort. To ensure impartiality and independence, it would require the set-up of environmental architecture that brings together academia, civil society organizations and specialized UN agencies and that facilitates data collection, analysis, review of findings and dissemination of results. Through the sharing of data, dissemination of methods and training of local groups, the aim should be to have a decentralized approach where researchers and NGOs can work independently on applying these methodologies and avoid a monopoly of (Western) specialist agencies or groups doing the analysis. Such a broad endeavour, with local and academic expertise, can provide rapid response where needed, share insights in country-specific cases when discussed in multilateral bodies and inform relevant international debates on the environmental consequences of conflict (and potentially be linked with similar efforts on climate change). While the humanitarian and environmental community is at the threshold of a new era, the spread of AI in data collection, sharing and analysis will certainly push the debate into a new dimension where speed, visibility and accuracy will be game-changing in policy discussions and environmental response mechanisms. These developments and insights will highlight the need for improved protection of the environment, and the people depending on it, in times of armed conflict.
- 1David Jensen and Silja Halle, Protecting the Environment during Armed Conflict: An Inventory and Analysis of International Law, United Nations Environment Programme (UNEP), 2009.
- 2Ken Conca and Jennifer Wallace, “Environment and Peacebuilding in War-torn Societies: Lessons from the UN Environment Programme's Experience with Post-Conflict Assessment”, Global Governance, Vol. 15, No. 4, 009, available at: www.jstor.org/stable/7800777 (all internet references were accessed in September 03).
- 3Official Records of the General Assembly, Sixty-Sixth Session, Supp. No. 10, UN Doc. A/66/10 and Add.1, 2011, para. 65.
- 4See the International Coalition to Ban Uranium Weapons, available at: www.icbuw.eu/en/about-us/.
- 5See the Vietnam Agent Orange Relief and Responsibility Campaign, available at: https://vn-agentorange.org.
- 6PAX, Laid to Waste: Depleted Uranium Contaminated Military Scrap in Iraq, June 2014, available at: https://paxforpeace.nl/media/download/pax-rapport-iraq-final-lowres-spr….
- 7Christina Roca, “How the Syrian War Changed How War Crimes Are Documented”, The New Humanitarian, 1 June, 201, available at: https://deeply.thenewhumanitarian.org/syria/articles/201/06/01/long-rea….
- 8Jeff Deutch and Hadi Habal, “The Syrian Archive: A Methodological Case Study of Open-Source Investigation of State Crime Using Video Evidence from Social Media Platforms”, State Crime Journal, Vol. 7, No. 1, 201, available at: https://doi.org/10.13169/statecrime.7.1.0046.
- 9Markus Rohde et al., “Out of Syria: Mobile Media in Use at the Time of Civil War”, International Journal of Human–Computer Interaction, Vol. 32, No. 7, 2016, available at: www.tandfonline.com/doi/full/10.1080/10447318.2016.1177300.
- 10Nina C. Müller and Jenny Wiik, “From Gatekeeper to Gate-opener: Open-Source Spaces in Investigative Journalism”, Journalism Practice, Vol. 17, No. 2, 2023, available at: https://doi.org/.80/17512786.2021.1919543.
- 11Eliot Higgins, We Are Bellingcat: An Intelligence Agency for the People, Bloomsbury, London, 2021.
- 12See, for example, the New York Times Visual Investigations team, available at: www.nytimes.com/spotlight/visual-investigations-award-winning; Mandal Chinula, “BBC Team Shares Insights behind Viral, Open-Source Investigation”, International Journalist Network, 17 December 2018, available at: https://ijnet.org/en/story/bbc-team-shares-insights-behind-viral-open-s….
- 13ICC, Warrant of Arrest: The Prosecutor v. Mahmoud Mustafa Busayf Al-Werfalli, ICC-01/11-02/17-2, 15 August 2017, available at: www.icc-cpi.int/court-record/icc-01/11-01/17-2.
- 14Toby McIntosh, “Environmental Crime and Climate Change”, in Reporter's Guide to Investigating Organized Crime, Global Investigative Journalism Network, 2023, available at: https://gijn.org/organized-crime-chapter-7-environmental-crimes/.
- 15Wim Zwijnenburg and Eliot Higgins, “Online Identification of Conflict Related Environmental Damage”, Bellingcat, 17 December 20, available at: www.bellingcat.com/resources/how-tos/20/12/17/online-identification-of-….
- 16Leo Posthuma et al., “The Flash Environmental Assessment Tool: Worldwide First Aid for Chemical Accidents, Response, Pro Action Prevention and Preparedness”, Environment International, Vol. 72, November 2014, available at: https://doi.org/10.10/j.envint.2014.04.018.
- 17PAX, Amidst the Debris: A Desktop Study on the Environmental and Public Health Impact of Syria's Conflict, October 2015, available at: https://paxforpeace.nl/what-we-do/publications/amidst-the-debris.
- 18PAX, Living under a Black Sky: Conflict Pollution and Environmental Health Concerns in Iraq, 5 December 2017, available at: https://paxforpeace.nl/what-we-do/publications/living-under-a-black-sky.
- 19Wim Zwijnenburg, “Donbas: A Ticking Toxic Time Bomb”, Bellingcat, 30 March 2017, available at: www.bellingcat.com/news/uk-and-europe/2017/03/30/donbas-ticking-toxic-t….
- 20UN Habitat, “Mosul Environmental Hazards Assessment”, 15 May 17, available at: http://unhabitatiraq.net/mosulportal/wp-content/uploads/17/06/170515_En….
- 21Richard Pendry, “New Technology, War, and Human Rights Reporting”, in Stephen J. A. Ward (ed.), Handbook of Global Media Ethics, Springer, Cham, 2019, available at: https://link.springer.com/chapter/10.1007/978-3-319-303-5_51.
- 22Rahul Katarya and Mahboob Massoudi, Recognizing Fake News in Social Media with Deep Learning: A Systematic Review, Fourth International Conference on Computer, Communication and Signal Processing, Chennai, India, 2020, available at: https://ieeexplore.ieee.org/abstract/document/9315255.
- 23Wim Zwijnenburg, “Environmental Monitoring of Conflicts Using Sentinel-2 Data”, Sentinel Hub Blog, 29 January 2019, available at: https://medium.com/sentinel-hub/environmental-monitoring-of-conflicts-u….
- 24Vincent Salomonson, William Barnes and Edward Masuoka, “Introduction to MODIS and an Overview of Associated Activities”, in John Qu, Wei Gao, Menas Kafatos, Robert Murphy and Vincent Salomonson (eds), Earth Science Satellite Remote Sensing, Springer, Berlin and Heidelberg, 2006, available at: https://doi.org/10.1007/978-3-540-37293-6_2.
- 25Xi Li, Fengrui Chen and Xiaoling Chen, “Satellite-Observed Nighttime Light Variation as Evidence for Global Armed Conflicts”, IEEE Journal of Selected Topics in Applied Earth Observations and Remote Sensing, Vol. 6, No. 5, 2013, available at: https://ieeexplore.ieee.org/document/6502753/.
- 26Ollie Ballinger and Wim Zwijnenburg, “What Oil Satellite Technology and Iraq can Tell Us about Pollution”, Bellingcat, 14 April 2021, available at: www.bellingcat.com/resources/2021/04/15/what-oil-satellite-technology-a….
- 27Oscar Björnham et al., “The 2016 Al-Mishraq Sulphur Plant Fire: Source and Health Risk Area Estimation”, Atmospheric Environment, Vol. 169, 2017, available at: https://doi.org/10.1016/j.atmosenv.2017.09.025.
- 28Hamid Jafarzadeh et al., “Oil Spill Detection from Synthetic Aperture Radar Earth Observations: A Meta-Analysis and Comprehensive Review”, GIScience and Remote Sensing, Vol. 58, No. 7, 2021, available at: www.tandfonline.com/doi/full/10.1080/15481603.2021.1952542.
- 29Kotsewararao Vankayalapati et al., “Multi-Mission Satellite Detection and Tracking of October 2019 Sabiti Oil Spill in the Red Sea”, Remote Sensing, Vol. 15, No. 38, 2023, available at: https://doi.org/10.3390/rs15010038.
- 30Amit Kumar, et al., “Analyzing Urban Damage and Surface Deformation Based Hazard-Risk in Kathmandu City Occurred During Nepal Earthquake (2015) Using SAR Interferometry”, Advances in Space Research, Vol. 70, No. 12, 2022, available at: https://doi.org/10.1016/j.asr.2022.02.003.
- 31Fernando Arturo Mendez and István Valánszki, “Environmental Armed Conflict Assessment Using Satellite Imagery”, Journal of Environmental Geography, Vol. 13, No. 3–4, 2021, available at: https://doi.org/10.2478/jengeo-2020-0007.
- 32Mohammed Ali Mohamed, “An Assessment of Forest Cover Change and Its Driving Forces in the Syrian Coastal Region during a Period of Conflict, 2010 to 2020”, Land, Vol. 10, No. 2, 2021, available at: https://doi.org/10.3390/land10020191.
- 33Oscar Bautista-Cespedes et al., “The Effects of Armed Conflict on Forest Cover Changes across Temporal and Spatial Scales in the Colombian Amazon”, Regional Environmental Change, Vol. 21, 2021, available at: https://doi.org/10.1007/s10113-021-01770-6.
- 34Elsa M. Ordway, “Political Shifts and Changing Forests: Effects of Armed Conflict on Forest Conservation in Rwanda”, Global Ecology and Conservation, Vol. 3, 2015, available at: https://doi.org/10.1016/j.gecco.2015.01.013.
- 35Khaled Hazaymeh et al., “A Remote Sensing-Based Analysis of the Impact of Syrian Crisis on Agricultural Land Abandonment in Yarmouk River Basin”, Sensors, Vol. 22, No. 10, 2022, available at: https://doi.org/10.3390/s22103931.
- 36Hadi H. Jaafar and Eckart Woertz, “Agriculture as a Funding Source of ISIS: A GIS and Remote Sensing Analysis”, Food Policy, Vol. 64, 2016, available at: https://doi.org/10.1016/j.foodpol.2016.09.002.
- 37Victor Mackenhauer et al., “The Impact of Conflict-Driven Cropland Abandonment on Food Insecurity in South Sudan Revealed Using Satellite Remote Sensing”, Nature Food, Vol. 2 No. 12, 2021, available at: https://doi.org/10.1038/s43016-021-00417-3.
- 38Alexandru Mereuţă et al., “A Novel Method of Identifying and Analysing Oil Smoke Plumes Based on MODIS and CALIPSO Satellite Data”, Atmospheric Chemistry and Physics, Vol. 22, No. 7, 2022, available at: https://doi.org/10.5194/acp-22-5071-2022.
- 39Noam Levin, Saleem Ali, David Crandall and Salit Kark, “World Heritage in Danger: Big Data and Remote Sensing can Help Protect Sites in Conflict Zones”, Global Environmental Change, Vol. 55, 2019, available at: https://doi.org/10.1016/j.gloenvcha.2019.02.001.
- 40Megan Zaroda, “NASA Harvest Tracks Frontline Agriculture Patterns with Planet's Satellite Data”, Planet, 5 September 2022, available at: www.planet.com/pulse/nasa-harvest-tracks-frontline-agriculture-patterns….
- 41Kaveh Khoshnood et al., Ukraine's Crop Storage Infrastructure: Post-Invasion Damage Assessment, Humanitarian Research Lab at Yale School of Public Health and Oak Ridge National Laboratory, 15 September 2022, available at: https://hub.conflictobservatory.org/portal/sharing/rest/content/items/6….
- 42PAX, Risks and Impacts from Attacks on Energy Infrastructure. Environment and Conflict Alert Ukraine, 2022, available at: https://paxforpeace.nl/what-we-do/publications/risks-and-impacts-from-a….
- 43Oleksandra Shumilova et al., “Impact of the Russia–Ukraine Armed Conflict on Water Resources and Water Infrastructure”, Nature Sustainability, Vol. 6, No. 5, 2023, available at: https://doi.org/10.1038/s41893-023-01068-x.
- 44World Wildlife Foundation, “High Conservation Values Matter in Wartime in Ukraine”, 29 December 2022, available at: www.wwfmmi.org/?85411/high-conservation-values.
- 45ZoI Environment Network, “Ecodozor Platform for Monitoring War-Related Environmental Damage and Risks in Ukraine”, 2023, available at: https://zoinet.org/product/ecodozor/.
- 46International Committee of the Red Cross (ICRC), Explosive Weapons With Wide Area Effects: A Deadly Choice in Populated Areas, Geneva, January 2022, available at: www.icrc.org/en/document/civilians-protected-against-explosive-weapons.
- 47See the article by Simon Bagshaw in this issue of the Review.
- 48PAX, “Exploring Environmental Harm from Explosive Weapons in Populated Areas”, May 2020, available at: https://paxforpeace.nl/news/blogs/exploring-environmental-harm-from-exp….
- 49UNEP, “Environmental Issues in Areas Retaken from ISIL Mosul, Iraq – Technical Note”, Geneva, 2017, available at: www.unep.org/resources/publication/environmental-issues-areas-retaken-i….
- 50PAX, “Gaza: Preliminary Urban and Environmental Impacts”, Environment and Conflict Alert No. 3, May 2021, available at: https://paxforpeace.nl/what-we-do/publications/environment-and-conflict….
- 51Yusupujiang Aimaiti et al., “War Related Building Damage Assessment in Kyiv, Ukraine, Using Sentinel-1 Radar and Sentinel-2 Optical Images”, Remote Sensing, Vol. 14, No. 24, 2022, available at: https://doi.org/10.3390/rs14246239.
- 52UN General Assembly, Protection of the Environment in Relation to Armed Conflicts, UN Doc. A/CN.5/L.968, 20 May 2022, available at: https://legal.un.org/docs/?symbol=A/CN.4/L.968.
- 53PAX, “Iraqis Fear Conflict Pollution Will Not Be Cleaned Up”, 5 December 2017, available at:: https://paxforpeace.nl/news/overview/iraqis-fear-conflict-pollution-wil….
- 54UNEA Res. 3/1, “Pollution Mitigation and Control in Areas affected by Armed Conflict or Terrorism”, 30 January 2018, available at: https://wedocs.unep.org/handle/20.500.11822/30792.
- 55Human Rights Council, Report of the Special Rapporteur on the Implications for Human Rights of the Environmentally Sound Management and Disposal of Hazardous Substances and Wastes, UN Doc. A/HR/33/41, 2 August 2016, available at: www.ohchr.org/en/calls-for-input/report-rights-child-and-hazardous-subs….
- 56Human Rights Council, Report of the Special Rapporteur on the Implications for Human Rights of the Environmentally Sound Management and Disposal of Hazardous Substances and Wastes, UN Doc. A/HRC/36/41, 20 July 2017, available at: https://documents-dds-ny.un.org/doc/UNDOC/GEN/G17/218/43/PDF/G1721843.p….
- 57PAX, “Protecting the Environment Is Protecting Civilians: The Humanitarian Dimensions of the Environment, Peace and Security Agenda”, UN Security Council Side-Event Summary, 2021, available at: https://protectionofcivilians.org/wp-content/uploads/2021/06/Event-Summ….
- 58UN Security Council, Protection of Civilians in Armed Conflict: Report of the Secretary-General, UN Doc. A/2022/281, 10 May 2022, available at: https://reliefweb.int/report/world/report-secretary-general-protection-….
- 59UN Security Council, Arria-Formula Meeting on the Protection of the Environment during Armed Conflict, 8 December 2019, available at: www.securitycouncilreport.org/whatsinblue/2019/12/arria-formula-meeting….
- 60UN Convention to Combat Desertification, “Briefing UN Security Council on Humanitarian Effects of Environmental Degradation on Peace and Security”, 17 September 2020, available at: www.unccd.int/news-stories/statements/briefing-un-security-council-huma….
- 61Gordana Kaplan et al., “Monitoring War-Generated Environmental Security using Remote Sensing: A Review”, Land Degradation and Development, Vol. 33 No. 10, 2022, available at: https://doi.org/10.1002/ldr.4249.
- 62Charles Leiserson et al., “There's Plenty of Room at the Top: What will Drive Computer Performance after Moore's Law?”, Science, Vol. 368, No. 6495, 2020, available at: www.science.org/doi/10.1126/science.aam9744.
- 63Patrick Merritt et al., “Big Earth Data: A Comprehensive Analysis of Visualization Analytics Issues”, Big Earth Data, Vol. 2, No. 4, 2019, available at: https://doi.org/10.1080/20964471.2019.1576260.
- 64Global Witness, “Myanmar's Poisoned Mountains. The Toxic Rare Earth Mining Industry at the Heart of the Global Green Energy Transition”, 2022, available at: www.globalwitness.org/en/campaigns/natural-resource-governance/myanmars….
- 65John Quinn et al., “Humanitarian Applications of Machine Learning with Remote-Sensing Data: Review and Case Study in Refugee Settlement Mapping”, Philosophical Transactions of the Royal Society A: Mathematical, Physical and Engineering Sciences, Vol. 376, No. 2128, 2018, available at: http://doi.org/10.1098/rsta.2017.0363.
- 66Ying-Nong Chen et al., “Special Issue Review: Artificial Intelligence and Machine Learning Applications in Remote Sensing”, Remote Sensing, Vol. 15, No. 3, 2023, available at: https://doi.org/10.3390/Rs15030569.
- 67Yonghao Xu et al., “AI Security for Geoscience and Remote Sensing: Challenges and Future Trends”, IEEE GeoScience and Remote Sensing Magazine, Vol. 11, No. 2, 2023, available at: https://arxiv.org/pdf/2212.09360.pdf.
- 68Seungwan Cho, Jungmok Ma and Oleg A. Yakimenko, “Aerial Multi-Spectral AI-based Detection System for Unexploded Ordnance”, Defence Technology, 2022, available at: https://doi.org/10.1016/j.dt.2022.12.002.
- 69PAX, Scorched Earth and Charred Lives. Human Health and Environmental Risks of Civilian-Operated Makeshift Oil Refineries in Syria, 5 September 2016, available at: https://paxforpeace.nl/what-we-do/publications/scorched-earth-and-charr….
- 70Available at: https://ollielballinger.users.earthengine.app/view/rojavaoil.
- 71Olivia Nielsen and Dave Hodgkin, “Rebuilding Ukraine: The Imminent Risks from Asbestos”, UN Office for Disaster Risk Reduction, 7 June 2022, available at: www.preventionweb.net/blog/rebuilding-ukraine-imminent-risks-asbestos.
- 72“Data from Satellites Reveal the Vast Extent of Fighting in Ukraine”, The Economist, 23 February 2023, available at: www.economist.com/interactive/briefing/2023/02/23/data-from-satellites-….
- 73Hannes Mueller, Andre Groeger and Jonathan Hersh, “Monitoring War Destruction from Space Using Machine Learning”, Proceedings of the National Academy of Sciences, Vol. 18, No. 23, 2021, available at: www.pnas.org/doi/epdf/10.10/pnas.2025400118.
- 74Frank Witmer, “Remote Sensing of Violent Conflict: Eyes from Above”, International Journal of Remote Sensing, Vol. 36, No. 9, 2015, available at: https://doi.org/10.1080/01431161.2015.1035412.
- 75ESA, “GHGSat Instruments”, 2023, available at: https://earth.esa.int/eogateway/missions/ghgsat#instruments-section.
- 76K. Khoshnood et al., above note 41.
- 77Meg Kelly and Katharine Houreld, “Satellite Imagery Shows Evidence of New Graves after Tigray Massacres”, Washington Post, 7 July 2023, available at: www.washingtonpost.com/world/2023/07/07/ethiopia-massacre-graves/.
- 78Joy Buolamwini and Timni Gebru, “Gender Shades: Intersectional Accuracy Disparities in Commercial Gender Glassification”, Proceedings of Machine Learning Research, Vol. 81, 2018, available at: https://proceedings.mlr.press/v81/buolamwini18a.html.
- 79Doug Weir, Dan McQuillan and Robert A. Francis, “Civilian Science: The Potential of Participatory Environmental Monitoring in Areas Affected by Armed Conflicts”, Environmental Monitoring and Assessment, Vol. 191, 2019, available at: https://doi.org/10.1007/s10661-019-7773-9.
- 80ICRC, Guidelines on the Protection of the Natural Environment in Armed Conflict, Geneva, 2020, available at: www.icrc.org/en/publication/4382-guidelines-protection-natural-environm….
- 81Kate Mackintosh and Lisa Oldring, “Watch This Space: Momentum Toward an International Crime of Ecocide”, Just Security, 5 December 2022, available at: www.justsecurity.org/84367/watch-this-space-momentum-toward-an-internat….
- 82Neither Russia nor Ukraine has ratified the Rome Statute. Ukraine has, however, made a declaration accepting the ICC's jurisdiction over its territory for a fixed time period.
- 83UNSC Res. 687, 3 April 1991, available at: https://uncc.ch/sites/default/files/attachments/documents/res0687.pdf.
- 84PAX, “A Preliminary Environmental Risk Assessment of the Kakhova Dam Flooding”, 13 July 2023, available at: https://paxforpeace.nl/news/a-preliminary-environmental-risk-assessment….
- 85UN Development Programme, “New Coordination Center to Assess Environmental Impacts of the War on Ukraine”, 10 March 2023, available at: www.undp.org/ukraine/press-releases/new-coordination-center-assess-envi….